FILE - In this Wednesday, Aug. 3, 2011 file photo, the remains of a carp are seen on the dry lake bed of O.C. Fisher Lake in San Angelo, Texas. According to data released by the National Oceanic and Atmospheric Administration on Tuesday, May 4, 2021, the new United States normal is not just hotter, but wetter in the eastern and central parts of the nation and considerably drier in the West than just a decade earlier. (AP Photo / Tony Gutierrez)

FILE - In this Wednesday, Aug. 3, 2011 file photo, the remains of a carp are seen on the dry lake bed of O.C. Fisher Lake in San Angelo, Texas. According to data released by the National Oceanic and Atmospheric Administration on Tuesday, May 4, 2021, the new United States normal is not just hotter, but wetter in the eastern and central parts of the nation and considerably drier in the West than just a decade earlier. (AP Photo / Tony Gutierrez)

America’s new normal: A degree hotter than two decades ago

America’s new normal temperature is a degree hotter than it was just two decades ago.

By Seth Borenstein

AP Science Writer

America’s new normal temperature is a degree hotter than it was just two decades ago.

Scientists have long talked about climate change — hotter temperatures, changes in rain and snowfall and more extreme weather — being the “new normal.” Data released Tuesday by the National Oceanic and Atmospheric Administration put hard figures on the cliche.

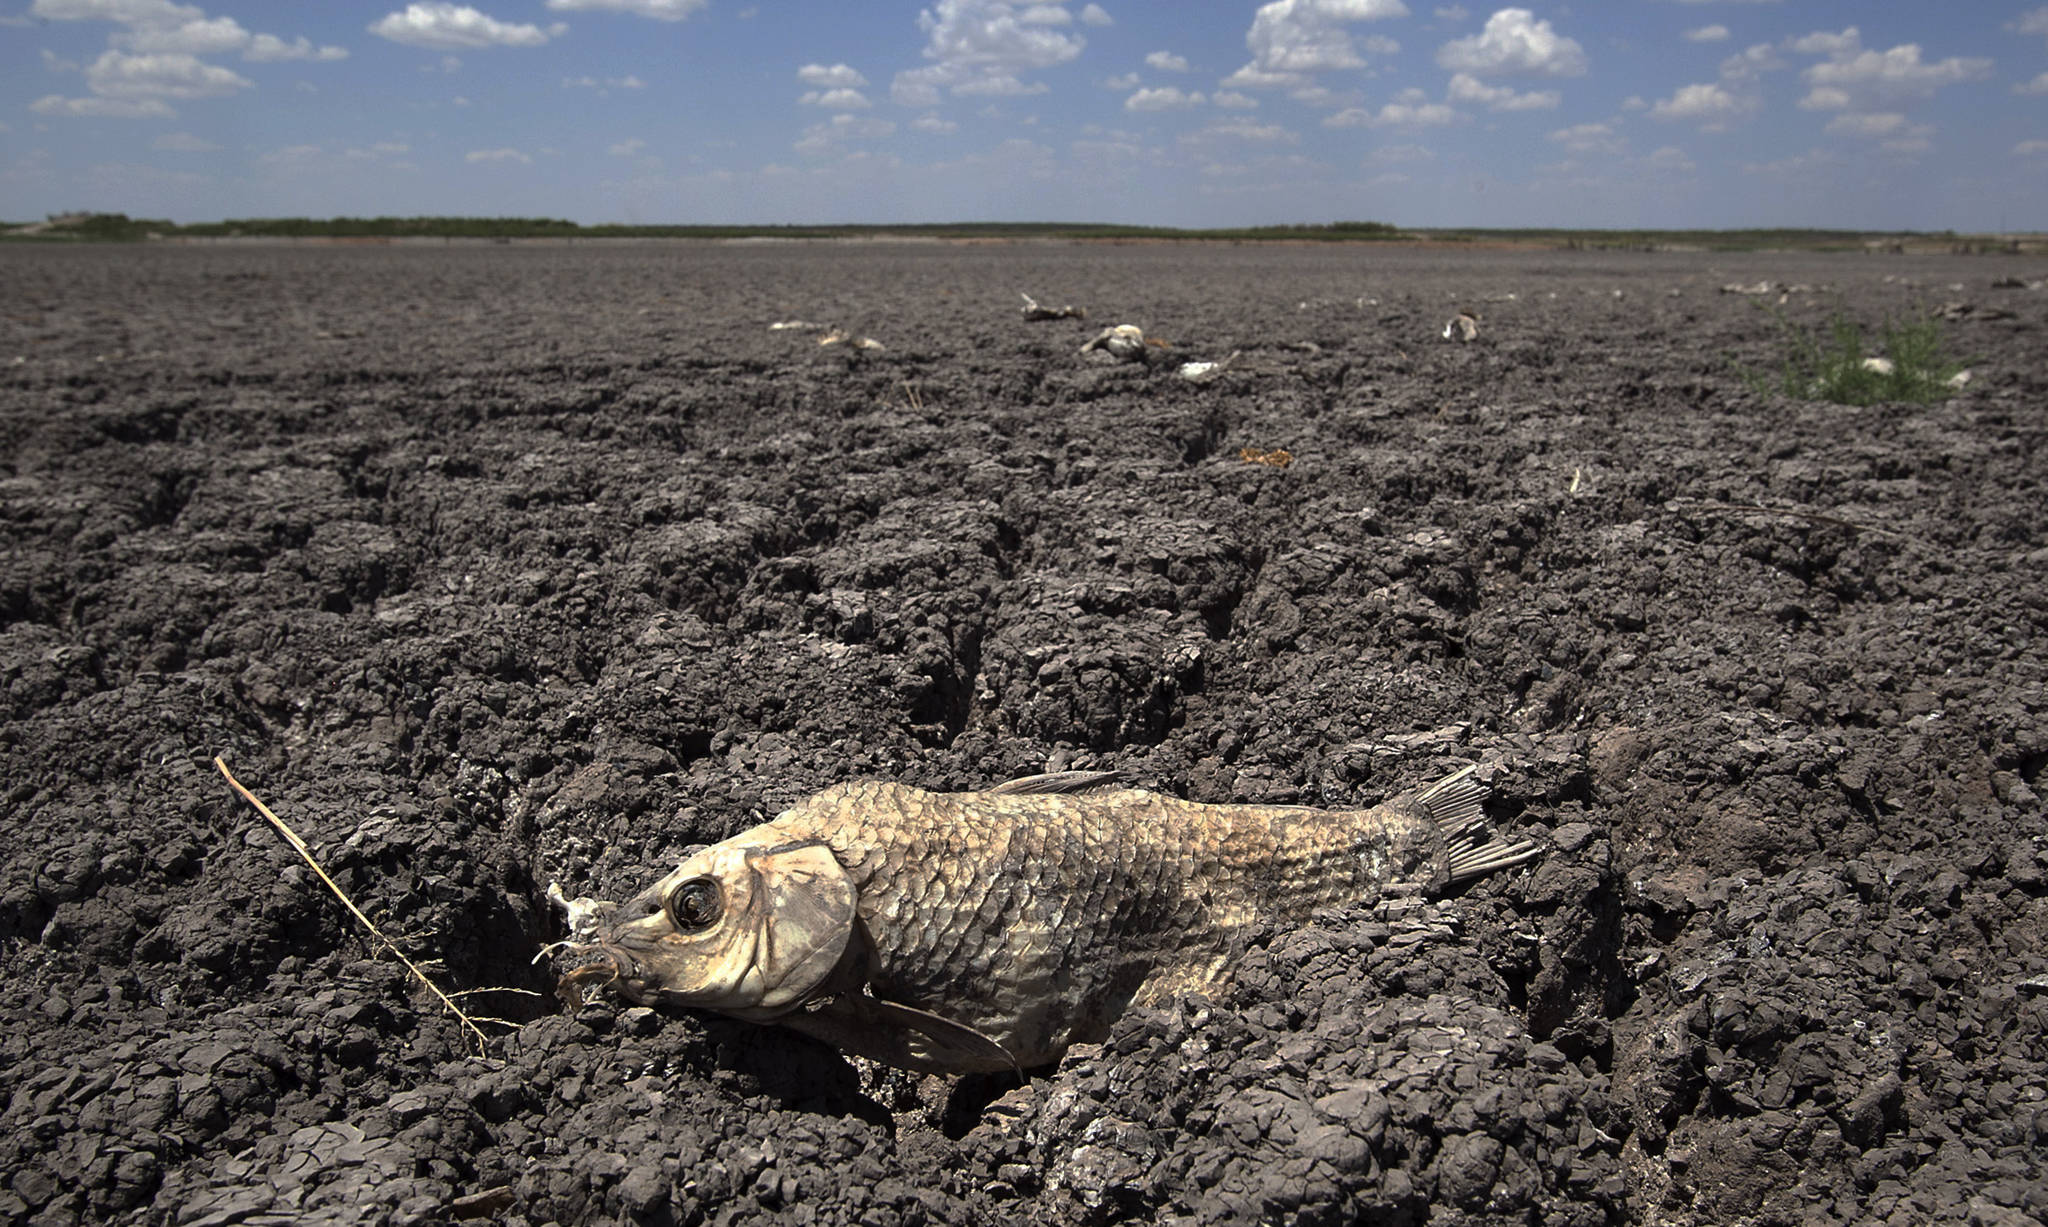
The new United States normal is not just hotter, but wetter in the eastern and central parts of the nation and considerably drier in the West than just a decade earlier.

Meteorologists calculate climate normals based on 30 years of data to limit the random swings of daily weather. It’s a standard set by the World Meteorological Organization. Every 10 years, NOAA updates normal for the country as a whole, states and cities — by year, month and season.

For the entire nation, the yearly normal temperature is now 53.3 degrees based on weather station data from 1991 to 2020, nearly half a degree warmer than a decade ago. Twenty years ago, normal was 52.3 degrees based on data from 1971 to 2000. The average U.S. temperature for the 20th century was 52 degrees.

Meteorologists in the U.S. use temperature datasets spanning 30 years to calculate temperature normals. The U.S. normal annual temperature is now 53.3 degrees Fahrenheit.

Meteorologists in the U.S. use temperature datasets spanning 30 years to calculate temperature normals. The U.S. normal annual temperature is now 53.3 degrees Fahrenheit.

The new normal annual U.S. temperature is 1.7 degrees hotter than the first normal calculated for 1901 to 1930.

“Almost every place in the U.S. has warmed from the 1981 to 2010 normal to the 1991 to 2020 normal,” said Michael Palecki, NOAA’s normals project manager.

Fargo, North Dakota, where the new normal is a tenth of a degree cooler than the old one, is an exception, but more than 90% of the U.S. has warmer normal temperatures now than 10 years ago, Palecki said.

In Chicago and Asheville, North Carolina, the new yearly normal temperature jumped 1.5 degrees in a decade. Seattle, Atlanta, Boston and Phoenix had their normal annual temperature rise by at least half a degree in the last decade.

Charlottesville, Virginia, saw the biggest jump in normal temperatures among 739 major weather stations. Other large changes were in California, Texas, Virginia, Indiana, Arizona, Oregon, Arkansas, Maryland, Florida, North Carolina and Alaska.

New normals are warmer because the burning of fossil fuels is making the last decade “a much hotter time period for much of the globe than the decades” before, said Cornell University climate scientist Natalie Mahowald.

For Phoenix, the biggest change in normal came in precipitation. The normal annual rainfall for Phoenix dropped 10% down to 7.2 inches. Rainfall in Los Angeles dropped 4.6%.

At the same time, Asheville saw a nearly 9% increase in rainfall, while New York City’s rainfall rose 6%. Seattle’s normal is 5% wetter than it used to be.

Climate scientists are split about how useful or misleading newly calculated normals are.

Mahowald and University of Oklahoma meteorology professor Jason Furtado said updating normal calculations helps city and regional planners to prepare for flooding and drought, farmers to decide what and when to plant, energy companies to meet changing demands and doctors to tackle public health issues arising from climate change.

But Pennsylvania State University climate scientist Michael Mann said he prefers a constant baseline such as 1951 to 1980, which is what NASA uses. Adjusting normal every 10 years “perverts the meaning of ‘normal’ and ‘normalizes’ away climate change,” he said in an email.

North Carolina’s state climatologist Kathie Dello said, “It seems odd to still call them normals because 1991-2020 was anything but normal climate-wise.”

More in News

(Juneau Empire file photo)
Aurora forecast through the week of Feb. 1

These forecasts are courtesy of the University of Alaska Fairbanks’ Geophysical Institute… Continue reading

Two flags with pro-life themes, including the lower one added this week to one that’s been up for more than a year, fly along with the U.S. and Alaska state flags at the Governor’s House on Tuesday. (Mark Sabbatini / Juneau Empire)
Doublespeak: Dunleavy adds second flag proclaiming pro-life allegiance at Governor’s House

First flag that’s been up for more than a year joined by second, more declarative banner.

Students play trumpets at the first annual Jazz Fest in 2024. (Photo courtesy of Sandy Fortier)
Join the second annual Juneau Jazz Fest to beat the winter blues

Four-day music festival brings education of students and Southeast community together.

Frank Richards, president of the Alaska Gasline Development Corp., speaks at a Jan. 6, 2025, news conference held in Anchorage by Gov. Mike Dunleavy. Dunleavy and Randy Ruaro, executive director of the Alaska Industrial Development and Export Authority, are standing behind RIchards. (Yereth Rosen/Alaska Beacon)
For fourth consecutive year, gas pipeline boss is Alaska’s top-paid public executive

Sen. Bert Stedman, R-Sitka, had the highest compensation among state legislators after all got pay hike.

Juneau Assembly Member Maureen Hall (left) and Mayor Beth Weldon (center) talk to residents during a break in an Assembly meeting Monday, Feb. 3, 2025, about the establishment of a Local Improvement District that would require homeowners in the area to pay nearly $6,300 each for barriers to protect against glacial outburst floods. (Mark Sabbatini / Juneau Empire)
Flood district plan charging property owners nearly $6,300 each gets unanimous OK from Assembly

117 objections filed for 466 properties in Mendenhall Valley deemed vulnerable to glacial floods.

(Michael Penn / Juneau Empire file photo)
Police calls for Sunday, Feb. 2, 2025

This report contains public information from law enforcement and public safety agencies.

(Michael Penn / Juneau Empire file photo)
Police calls for Saturday, Feb. 1, 2025

This report contains public information from law enforcement and public safety agencies.

(Michael Penn / Juneau Empire file photo)
Police calls for Friday, Jan. 31, 2025

This report contains public information from law enforcement and public safety agencies.

University of Alaska President Pat Pitney gives the State of the University address in Juneau on Jan. 30, 2025. She highlighted the wide variety of educational and vocational programs as creating opportunities for students, and for industries to invest in workforce development and the future of Alaska’s economy. (Corinne Smith/Alaska Beacon)
University of Alaska president highlights impact on workforce, research and economy in address

Pat Pitney also warns “headwinds” are coming with federal executive orders and potential budget cuts.

Most Read